Divvy vs Chicago Weather
Exploring Chicago’s weather
Everyone who’s lived in Chicago knows about its weather. We get all four seasons, and not necessarily in the expected order. The “feels like” temperature last year ranged from -40 to 95 degrees Fahrenheit. The Windy City lived up to its name with gusts up to 55 mph and the rain and snow was ever present. Throughout all this though, Divvy cyclists powered through, cycling on all but two days of the year, and that’s only because the system was shut down!! Let’s explore how the various forms of weather affected Divvy riders last year.
Temperature
Temperature and Divvy trips for every day in 2014
Obviously no-one likes cycling in cold weather, so a good place to see how weather affects Divvyers is the temperature. The graph below shows the average “feels like” temperature in Chicago for every day in 2014. You can see the long, cold period we had in the first few months, then a lovely mild summer with no sweltering hot days, followed by a relatively mild beginning of winter at the end of 2014. On the same graph, I’ve plotted the number of Divvy trips taken each day in 2014 and, as you’d expect, when the weather warms up throughout the year, people use Divvy much more. It’s especially interesting to look at the times in March when the temperature first gets above 40 degrees, Divvy ridership spikes correspondingly, just like the first time the temperature spikes above 60 degrees in May. From seeing this overall trend, let’s see how well temperature and ridership are correlated.
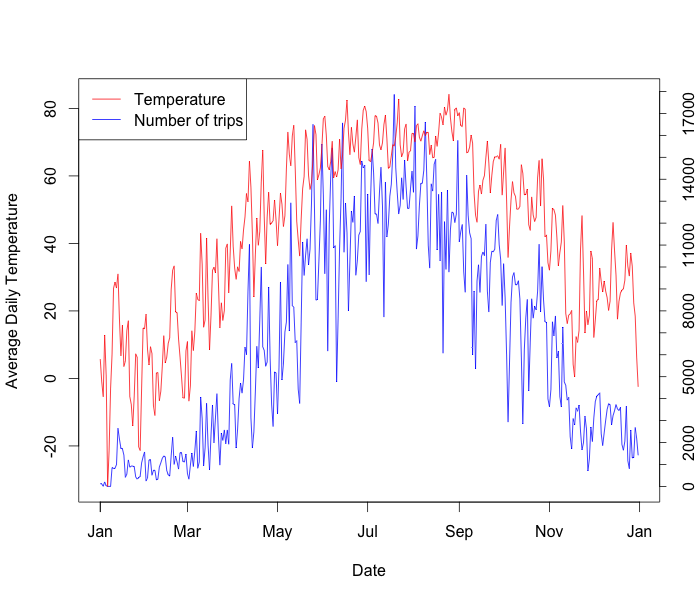 Figure 1: The number of trips taken each day of 2014 tracks very well with the temperature for the day. This is especially true for days when there is a significant increase in temperature. There’s nothing like a sunny day in March to make you want to cycle down the lakeshore!!
Temperature vs Number of Trips
In the next figure, I’ve plotted the temperature and number of trips for each day against each other. In case you’re unfamiliar with this type of visualization, each point on the graph is an individual day. The x-position for the point is the temperature for that day and the y-position is the number of Divvy trips taken that day. As you can see, as the temperature increases, the number of trips taken increases rapidly. The overall trend roughly follows (temperature)2 i.e. when the temperature doubles, the number of trips taken quadruples. It’s also possible to fit the data to two straight lines, one below freezing and one above freezing since it’s pretty easy to see that there is an elbow in the graph at around 32 degrees F. Unfortunately (for the purposes of analysis, not for real life!) this summer was particularly mild, so we can’t see what effect really hot weather has on Divvy ridership. I would imagine that the number of trips per day would start to fall off as the temperature got above 100 degrees F, but we can’t see that from the 2014 data. There’s maybe a hint of this effect in the fact that the top 5 days for Divvy ridership all occured below 75 degrees F, but we’ll need more hot weather data to be sure.
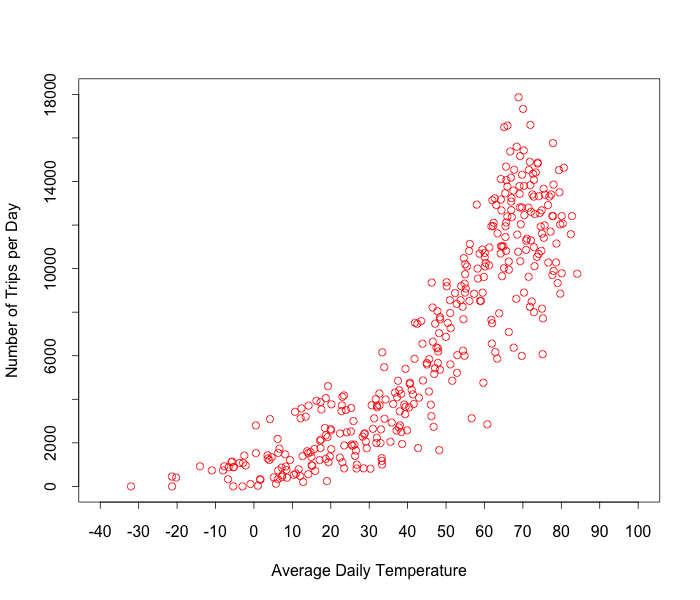 Figure 2: Temperature and number of trips taken correlate very well, following both a (temperature)2 trend or two linear trends above and below freezing. We don’t see any falloff in number of trips taken in very warm weather just yet.
Divvy includes in the data about each trip whether the person taking the trip has a Divvy membership or whether they just have a daily Divvy pass. My assumption about these two groups of people is that Divvy members primarily use it for their commutes and non-members are tourists or pleasure-bikers, and the temperature data helps to bear that out. The plot below is the same as Figure 2, but now I have split the data into whether the person taking a trip is a member or non-member. Looking at the non-member data, we can see that if the temperature is below freezing, there are barely any non-members using Divvy, and as the weather warms up there is an explosion in trips taken, up to 12,000 trips per day. Members however are much hardier creatures, with thousands of trips per day still being taken in negative temperatures!! There isn’t a much better testament to the toughness of Chicagoans than the fact there were over 400 trips taken on days when the temperature felt like negative 20 degrees fahrenheit!!! Thinking about the lunatics who were out cycling in that type of temperature made me wonder how long they were suffering out there, and then how long trips taken on Divvy are in general, and whether they get shorter as the temperature drops.
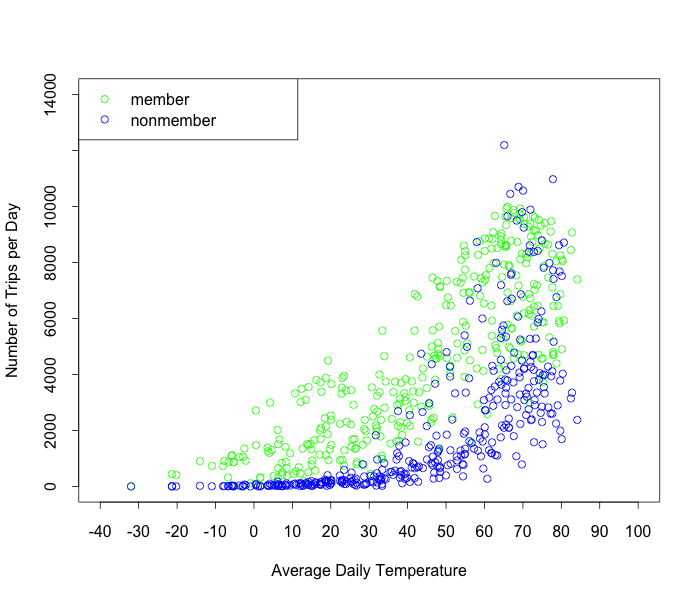 Figure 3: Members (those with yearly passes) and non-members (those with daily passes) show very different behaviour. Members tend to use Divvy for commuting and so travel even in very cold weather, whereas non-members use Divvy for pleasure, and there’s nothing pleasurable about cycling in below freezing weather, so they take very few trips below 32 degrees F.
Temperature vs Length of Trips
In this figure I’ve plotted the average trip duration vs the temperature. It’s interesting to note that the maximum length of time you can have a Divvy bike out before you are charged extra is 30 minutes, and the average length of trips for every day is less than 30 minutes. People really don’t want to pay extra! More interestingly for this discussion, we can see a clear relationship between temperature and average length of trip. The average length of a trip at 80 degrees F is roughly 5 minutes longer that the average length of a trip at 0 degrees F. We can drill down into the main cause of this by examining the differences between members and non-members in the next figure.
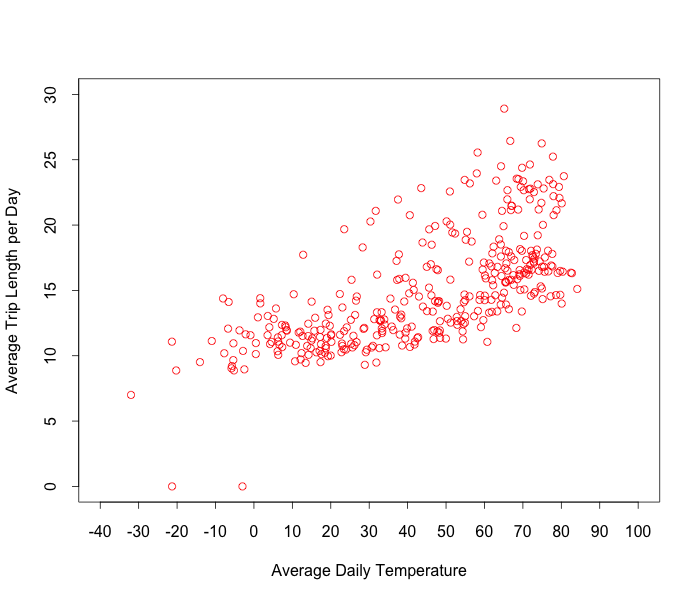 Figure 4: As temperature increases, the average length of a Divvy trip increases.
In this figure you can see the large difference between the behavior of members vs non-members. The average length of a member trip is about 10 minutes, which jibes well with the idea that most members use Divvy for the last part of their commute, e.g. from the train to their house. The average length of a non-member trip is much closer to 30 minutes, the maximum allowed time you can take a bike out before extra charges. Clearly non-members want to get the most “value” from their daily pass and are taking much longer trips. In addition, both types of behavior change very little as temperature changes. Members consistently average about 10 minutes per trip in cold weather or warm, with a slight increase of about 2 minutes over the range of temperatures we saw. Non-members show a slightly larger increase in average trip length, but the large increase we see in average trip length we saw in Figure 4 has more to to with the shift in the types of users at different temperatures we saw in Figure 3, with more members at low temperature, and a 50/50 mix of members and non-members at higher temperatures.
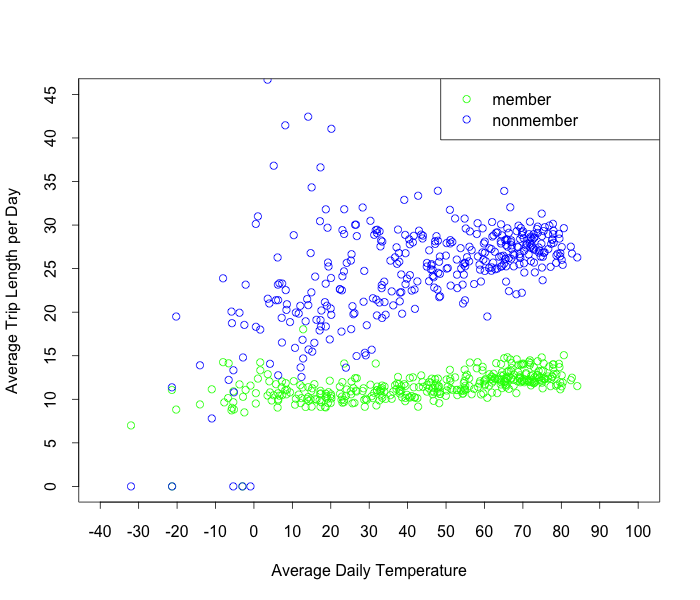 Figure 5: Members and non-members show very different behavior. Members take short trips in all weather but non-members take much longer trips and their trips get shorter as the weather cools down.
Rain (well, actually clouds!)
As there was great correlation between temperature and people’s Divvy riding habits, I was excited to see how other types of weather would affect Divvy ridership. Again, no-one likes riding in the rain, so I expected to see much fewer trips on days when it rained. In the figure below, we can see there’s no correlation between the probability of rain and Divvy ridership. There tended to be just as many trips on days where there was a 100% probability of rain as there were on days where there was a 0% probability of rain.
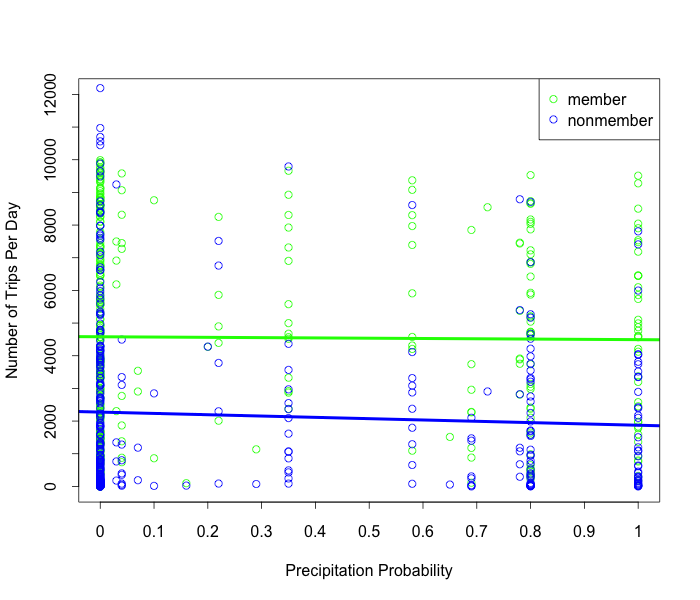 Figure 6: No correlation is seen between the probability of precipitation and number of Divvy riders. This is somewhat difficult to see in the points alone, so I’ve fit a straight line to the data to show that there is almost no decrease in the number of trips taken per day as the precipitation probability increases.
When we look at cloud cover though, (where 0 = blue skies and 1 is a totally cloudy sky) we can see there is a definite decrease in the average number of trips taken per day when the cloud cover increases. This suggests that people use the clouds as their own rain forecast. Similar to temperature, we see that high cloud cover really cuts the non-member trips down, while members are more happy to risk getting caught in a shower.
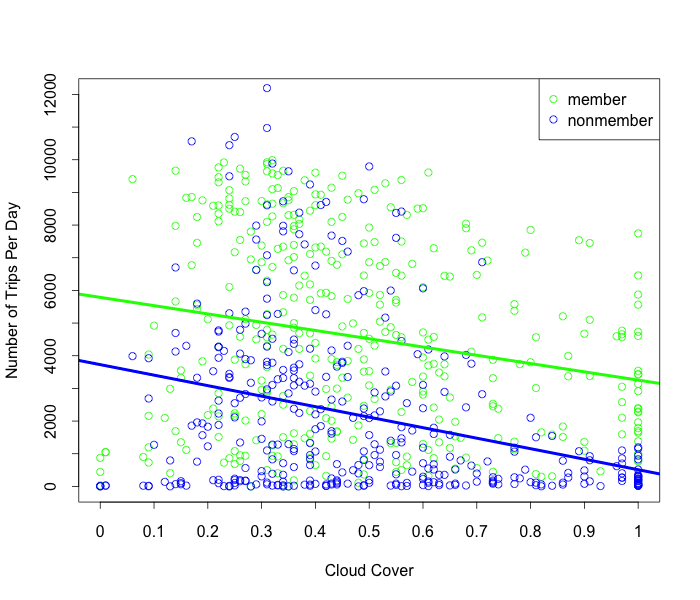 Figure 7: There is a strong correlation between cloud cover and number of trips taken, especially for non-members. If the cloud cover is above 75%, there are never more than 2,000 non-members trips, where there are up to 12,000 non-member trips on clearer days.
The Windy City
A discussion about the effects of weather in Chicago would not be complete without talking about the wind! The wind data gives the average daily wind speed in miles per hour, with average speeds up to 25 mph seen in 2014. It should be noted that these daily averages will be lower than the max wind speeds seen. As we can see in the figure, wind speed has very little effect on the number of trips taken when it’s below about 15 mph, with no clear correlation between wind speed and number of trips taken in a day. However, once the average wind speed gets above 15 mph, the number of trips taken per day drops off dramatically. 15 mph corresponds to a moderate to fresh breeze at which point “dust and loose paper raised, small branches begin to move” according to wikipedia, so it clearly doesn’t take much of an average wind speed to stop people Divvying. It’s also interesting to note that the drop off in number of trips taken happens at 15 mph for both members and non-members. For both temperature and rain/cloud cover, we saw that members were willing to take their short 10 minute cycles in worse weather than non-members did. Wind is the great equalizer though it seems, no-one wants to battle through a windy day on a Divvy.
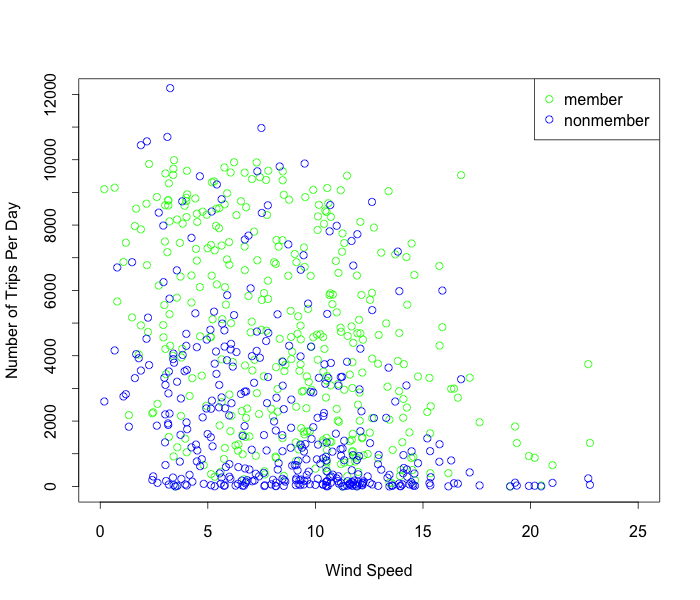 Figure 8: There is no correlation between wind speed and number of trips taken when the wind speed is below about 15 mph. Once the average wind speed for the day gets above about 15 mph, the number of trips for the day drops to much lower values.
There is one clear outlier on this figure however, the member point at wind speed = 23 mph, number of trips = 4000. It got me worrying whether I had made some mistake in processing my data, as I didn’t think it was reasonable for 4000 people to be willing to cycle on one of the windiest days Chicago had last year! Once I looked at the day for that data point I realized what was going on. That data point represents October 31st 2014, Hallowe’en, so clearly people were willing to cycle to their costume parties whatever the weather. I still wanted to make sure I hadn’t made some error in processing the data, so I checked the weather in Chicago for Hallowe’en in 2014 and I came across this video.
Nothing embodies the ridiculous levels that Divvy riders went last year better than this video. Not only did someone walk up to a Divvy station, see the bikes blowing in the wind like flags and still hop on and cycle off, but thousands of other someones did the exact same thing!! Either Chicagoans DGAF about the weather at Hallowe’en or we had 4000 extremely commited Wicked Witches of the West.
Conclusion
Overall we’ve seen that the weather has a strong effect on Divvy riding. Non-members show the most sensitivity to the weather, which fits with their usage of Divvy for pleasure. Members tend to be more consistent in their riding patterns, which fits with their usage of Divvy for short commutes. We also saw that temperature has by far the strongest effect on ridership, with strong winds and cloudy skys also having an effect. Finally, we have proof for the claim that Chicagoans are don’t care about bad weather, with many trips taken by members on days with negative Fahrenheit temperatures and 50 mph gusts of wind.
If anyone would like to see how I analyzed the Divvy and weather data, I have all my code on github where you can download it and play with it yourself. All weather data is from forecast.io