What is a simulation
A simulation is the imitation of the operation of a real-world process or system over time
INTRODUCTION TO SIMULATION, Jerry Banks
I think of a simulations as trying to reproduce reality in a simpler, modifiable setting.
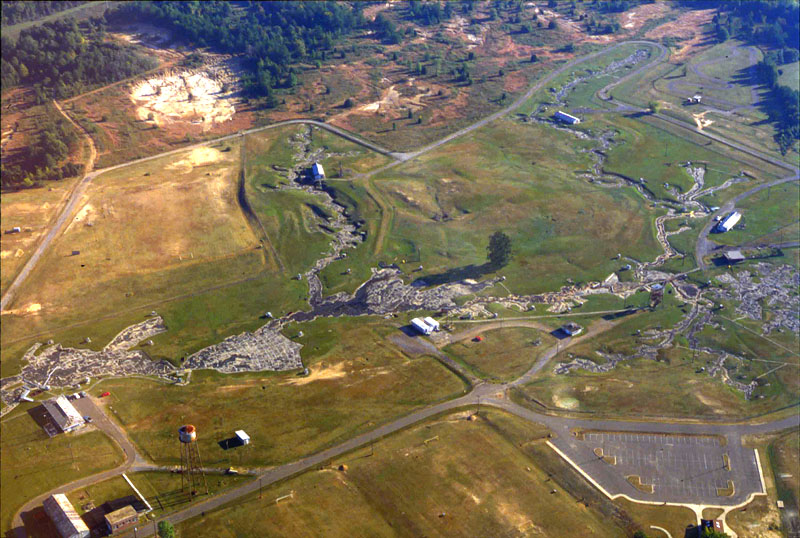
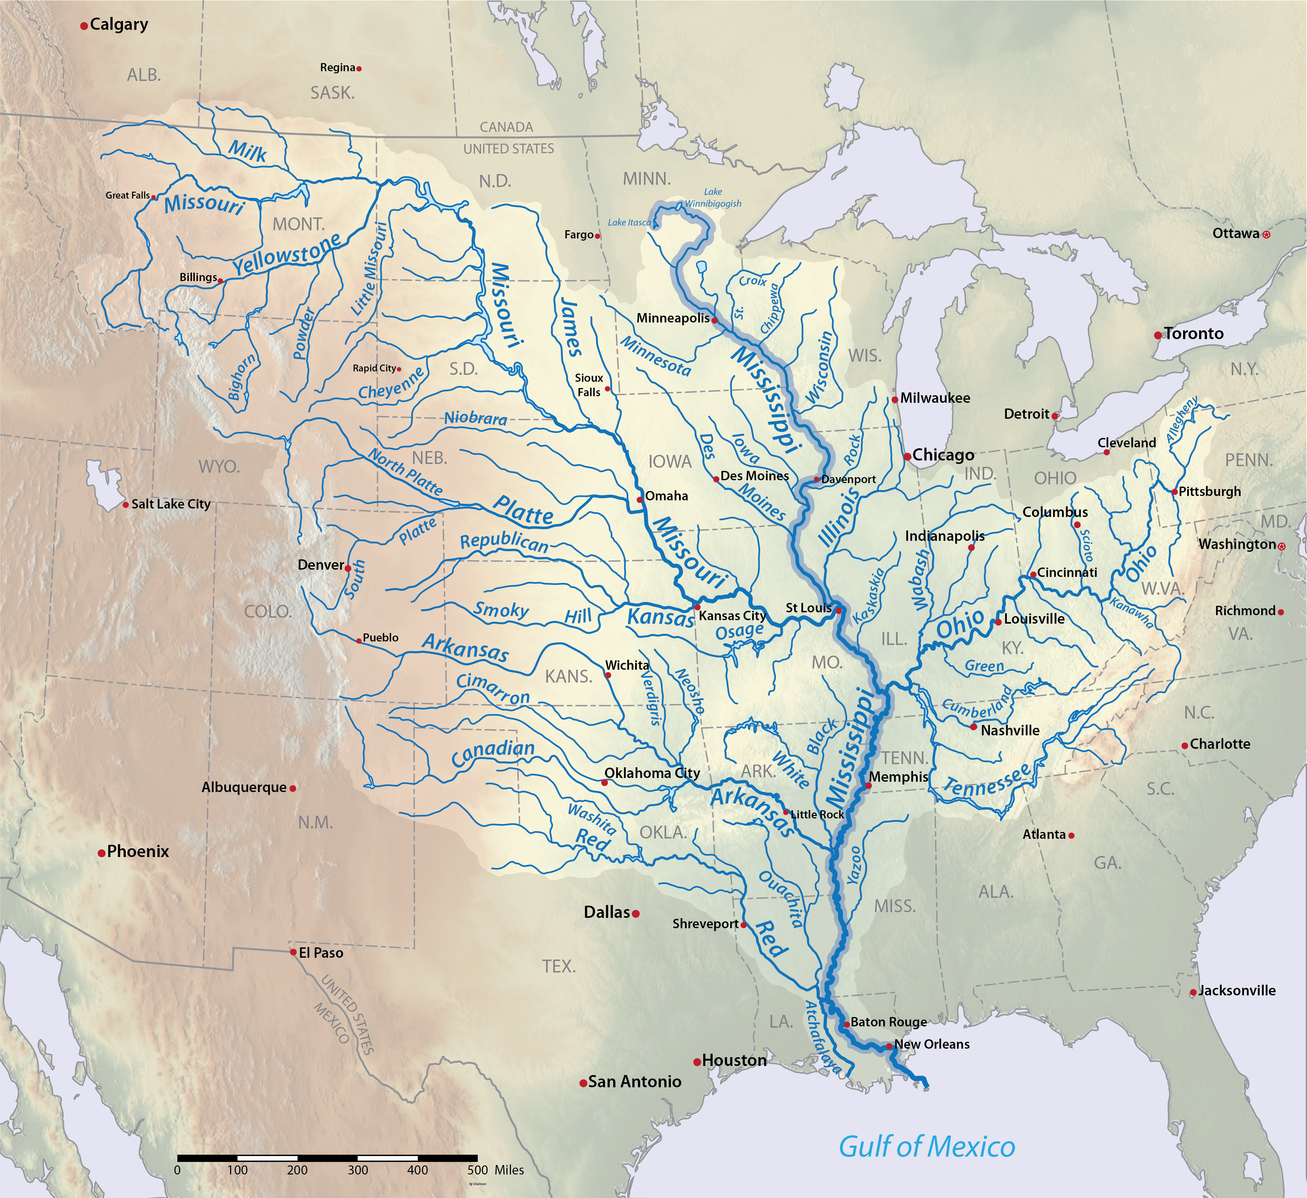
A very tangible example of a simulation is the Mississippi River Basin model.
This was built in the 1940s to aid systematic understanding of flood control measures that had been built on the Mississippi river in the previous decade.
These locks, run-off channels and levees could prevent local flooding but may increase flooding in other areas so it was clear that a big picture understanding of how to implement these measures was needed.
Various segments of the Mississippi River became operational in the simulation throughout the 1950s, helping to avoid damage of an estimated $65 million in 1952 along (almost a billion dollars in today’s money)
Tests on individual problems were conducted until 1971 but high costs and growth of computer modelling meant that the facility was put on standby.
We can use this example to explore the different parts that make up a simulation.
What makes up a simulation
It’s useful to separate the components of a simulation into three different parts: Input, Mechanism, and Output
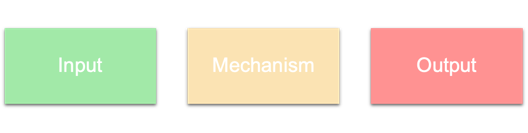
For example in the Mississippi River Basin Model, the Input is the amount of water added at upstream points, and the Output is the water heights at downstream points at various times.
The Mechanism is a literal recreation of the landscape at reduced scales, and the simulation propagates along using real physics (gravity, hydrodynamics etc).
Many successful simulations take advantage of re-using parts of the real system for their mechanism.
An important part of the mechanism are the configuration parameters, which in this case would be the various settings of the dams and levees.
Many different simulations can be run with various Inputs and Mechanism config parameters to obtain Outputs.
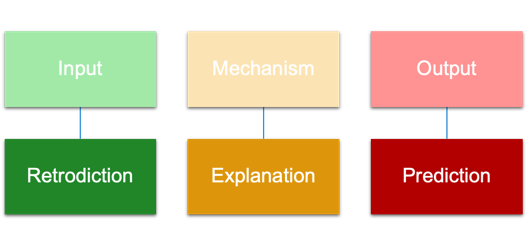
Depending on which part of the simulation is generating new data, the simulation is used for different purposes.
For many practical applications, simulations are used for Prediction, i.e. the Mississippi River Basin Model was mostly used to predict what Outputs would arise from various rainfall levels and flood control measure settings.
For more theoretical applications, simulations are used for Explanation. Given Inputs that produce known Outputs in reality, if a Mechanism can reproduce these we can gain confidence that this corresponds to reality.
This can be particularly useful in applications where fine-grained measurements of reality aren’t possible. Imagine in 1950s that scientists wanted to understand the mechanism of water flow in remote regions of the Mississippi basin.
Before satellites this measurement would have been difficult, but using a simulation these scientists could examine this in fine detail.
In computer simulations, scientists may try to simplify the mechanism to the bare minimum required to reproduce known Outputs from Inputs, thus gaining theoretical understanding of their domain.
A less common application is to use simulations for Retrodiction. An interesting example of this is the theory that a planet known as Theia smashed into Earth billions of years ago which resulted in the formation of our Moon.
Many different Inputs (planet sizes, speeds etc) were trialed to find ones that match an Output of an Earth and Moon systems like ours (with the Mechanism being a physics engine)
Correspondence
It is the designer’s or user’s intentions that determine what a simulation is a simulation of and what features are to be taken as corresponding with reality.
Regardless of the use of the simulations, there are questions being asked by the users of the simulation. Depending on the questions being asked, the simulation will need to more or less complex. There will be aspects of reality that are clearly not needed in the simulation (e.g. the phases of the moon don’t need to be considered in a molecular simulation) and aspects of reality that are clearly necessary in the simulation (e.g. the electromagnetic force is necessary for a molecular simulation). The craft of building a simulation arises in determining the aspects of reality that aren’t needed in the simulation and can be ignored, which generally allows the simulation to run for longer or be calibrated more easily (or simply make it feasible to build at all). The degree to which your simulation contains the aspects of reality required to answer your question is known as the correspondence of your simulation.
To examine this idea of correspondence, we can look at three different methods of simulating the spread of infectious diseases.
Time Series
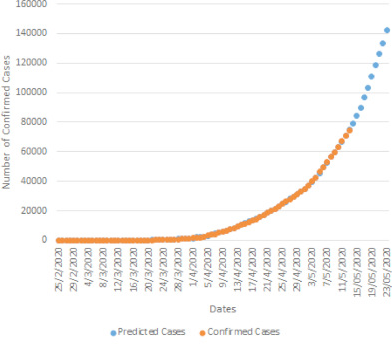
In a time series, we predict the Output, the incidence of disease in the population,
using a predictive model fit on some training data (historical Inputs and Outputs), see this study as an example.
While this satisfies the technical definition of a simulation, with Inputs, (an extremely simple) ‘Mechanism’, and Outputs,
and can answer important questions about the future of a disease, it doesn’t feel like the type of think we think of when we think of simulations.
Let’s examine some other methods before we examine why this doesn’t seem like a good simulation.
Compartmental Model
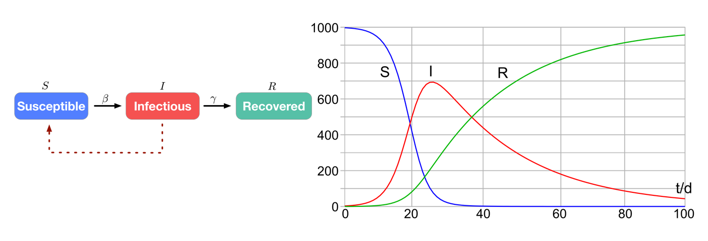
In compartmental models, a population of people is modelled, and each person in the population is assigned to one of three buckets: Susceptible, Infectious, or Recovered. At the beginning of the simulation all but a small number of people are in the Susceptible bucket. At each timestep of the simulation, there a probability that a Susceptible person will move to the Infected bucket, defined by the parameter β. There is also a probability that a person in the Infected bucket will move to Recovered, defined by the parameter γ.
As this simulation moves through time, we will see an exponential increase in the number of people in the Infected bucket, until it reaches a peak and then decays towards zero, as can be seen in the red line in the figure above. This was the infamous curve that we all wanted to flatten at the beginning of the COVID pandemic, which can be flattened in the simulation by decreasing the parameter β. In fact, you may remember at the beginning of the COVID pandemic that we all kept very close watch on R0, the basic reproduction number of the disease, and R0 is simply calculated from β / γ.
By varying the parameters β and γ diseases of different infectivities and populations with different behaviours can be modelled. 1 This allows researchers and public health officials predict what the likely outcome of various treatments or government measures would be on the spread of the disease. There are many more extensions that can be made to this compartmental model to better match the details of the disease of interest, but this one will do for our discussion.
Agent-based Model
 https://pubmed.ncbi.nlm.nih.gov/16642006/
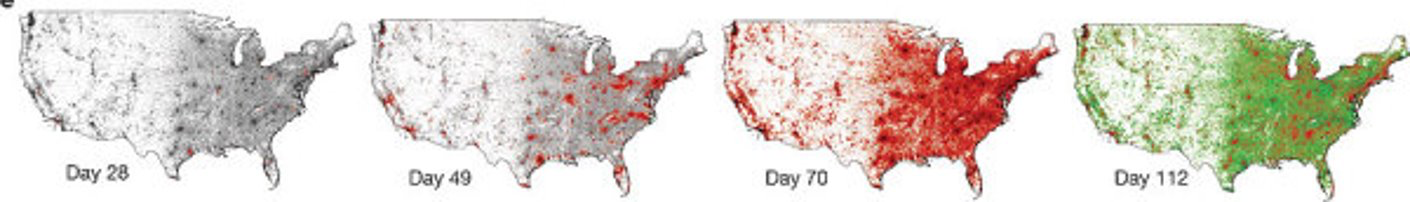
In agent-based models, a population of people are again modelled,
but this time each person’s locations, movements, activities, and interactions with others etc. are all modeled.
This results in the same curve of infection we have seen in the compartmental model, however the large increase in complexity means it much more closely models reality.
This complexity allows the answering of much more complex questions.
In a 2006 paper a agent-based study looked at the effectiveness of various prevention and containment strategies for an Influenza epidemic.
They found that
https://pubmed.ncbi.nlm.nih.gov/16642006/
In agent-based models, a population of people are again modelled,
but this time each person’s locations, movements, activities, and interactions with others etc. are all modeled.
This results in the same curve of infection we have seen in the compartmental model, however the large increase in complexity means it much more closely models reality.
This complexity allows the answering of much more complex questions.
In a 2006 paper a agent-based study looked at the effectiveness of various prevention and containment strategies for an Influenza epidemic.
They found that
- border restrictions and/or internal travel restrictions are unlikely to delay spread by more than 2–3 weeks unless more than 99% effective.
- School closure during the peak of a pandemic can reduce peak attack rates by up to 40%, but has little impact on overall attack rates,
- Case isolation or household quarantine could have a significant impact, if feasible
This level of detailed prescription likely helped give confidence to governments around the world to implement stay-at-home orders that would damage their economies. The complexity of these simulations come with a hefty price however, with the many parameters making them extremely difficult to calibrate and the level of detail causing them to be quite expensive to run.
Correspondence
Clearly these three types of simulations have very different levels of correspondence to reality. For infectious disease modelling, clearly we need to have some representation of individuals and movement of disease between individuals at the very least.
- Time series models have no correspondence to these things that matter, so don’t let us ask very many questions that matter
- Compartment models have the bare minimum of correspondence, so we can only ask the bare minimum of questions
- Agent based models have correspondence with many more parts of reality, and so we can ask much more complex questions, at the cost of complexity
In tension with this increasing ability to answer important questions about the system of interest, is the ability to set up a calibrated simulation and to run the many different realisations of the simulation needed for exploration of the problem space and for statistical significance.
So the design of a simulation comes down to deciding on the questions that need to be answered, what aspects of reality matter to answering those questions. These aspects of reality clearly must be represented faithfully in the mechanism.
For example in the compartmental model, even though it is an extremely simple simulation, the two aspects of the problem that matter in reality do correspond in the simulation. What about an aspect of disease spread that we know is important in reality, for example how much people move around and interact with other people. In the compartmental model, this is baked into the β parameter, so this doesn’t correspond to reality. However this is an intentional choice by the designers of the simulation. Many important parts of real-life disease spread are abstracted into the β parameter, allowing epidemiologists to study the dynamics of diseases more generally and extremely efficiently. If we do want to ask questions about people’s movement, then we need to ensure this is represented faithfully in the simulation, as is done in the agent-based model.
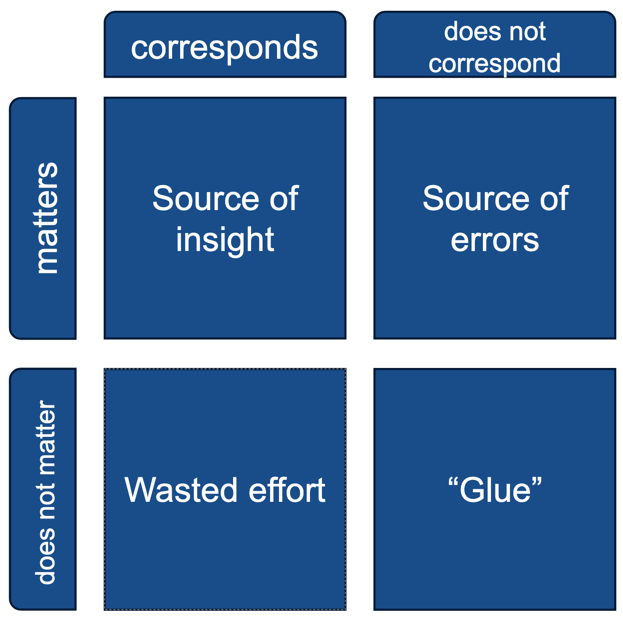
We can therefore break up the aspects of reality into the parts that matter to answering the question and the parts that don’t. In the simulation, the parts that matter must correspond in the simulation to gain insights, otherwise you will get erroneous results. For the parts of reality that don’t matter, making them correspond will generally lead to wasted resources in simulation setup and runtime. These parts can either be ignored if they are truly not relevant (e.g. we don’t need to simulate tectonic plates in a disease simulation), or abstracted into parameters or components of the simulation. For example, the β parameter in the compartmental model doesn’t correspond to anything concrete in reality, but stands in for many different aspects of disease spread from infected to non-infected people (e.g. contact rates, disease infectivity, mask wearing etc.) It’s important to note that correspondence to reality is subjective, and even the agent-based models have been criticized for simplifying and unrealistic assumptions
Why use simulations
- Make predictions about the future
- Too risky/expensive to do in reality
- Floods of areas
- Too slow to do in reality
- Simulate the cosmic web
- Need to run too many experiments
- Waymo has driven 1000x more in simulations than in reality
- Reinforcement learning requires more data than reality can provide
- Impossible to make measurements of real system
- Protein simulations allow visualization of the movement of proteins
Conclusion
You should simulate too. If you want to, look into reinforcement learning papers to find how they’ve simulated since it’s so data hungry. Simulation is used in many real-world applications, and we in the data/software field should take note of the potential for our domains.
There are many other aspects of running a simulation that are interesting to discuss which I may add in future parts, including calibration of simulations and avoiding “production bias” in simulation results, as well as more on the “SimOps” of running and analysing simulations.
]]>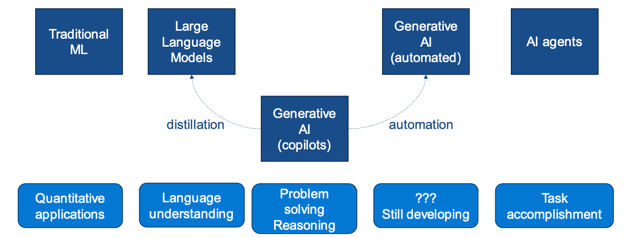
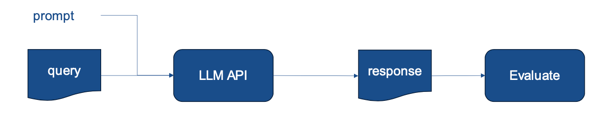
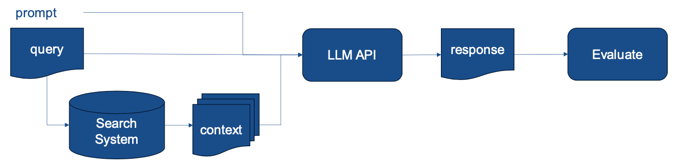 Providing relevant information allows the model to respond with information not in its training data and
also helps prevent fabrication of plausible but non-existent information.
The main limitation is the quality of the search system, if you have low recall you will not be providing the
model with the facts it requires for its reasoning.
Providing relevant information allows the model to respond with information not in its training data and
also helps prevent fabrication of plausible but non-existent information.
The main limitation is the quality of the search system, if you have low recall you will not be providing the
model with the facts it requires for its reasoning.

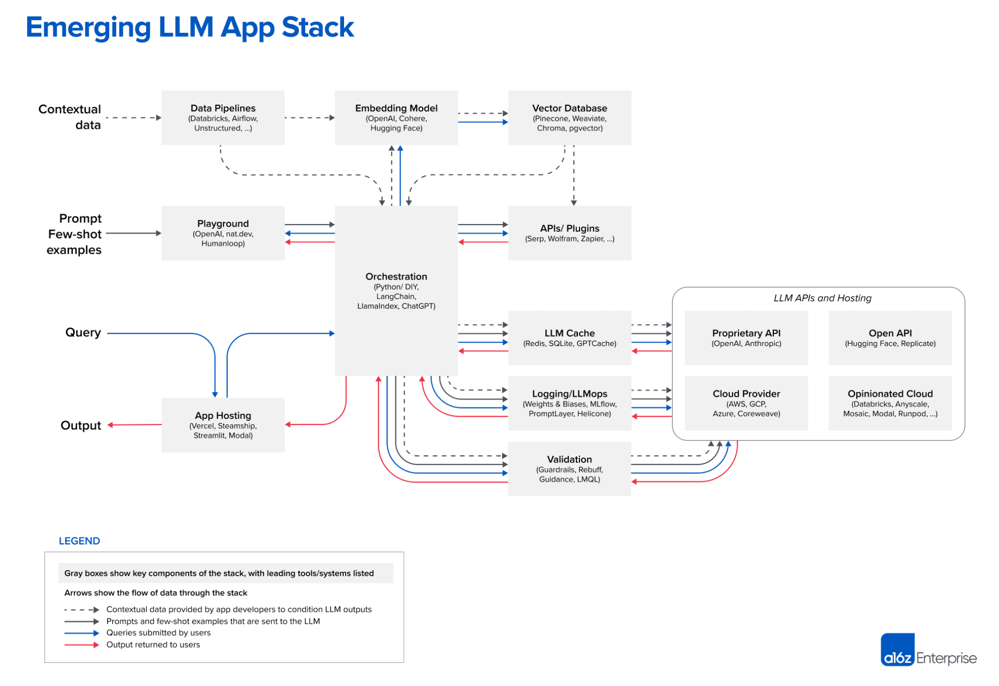
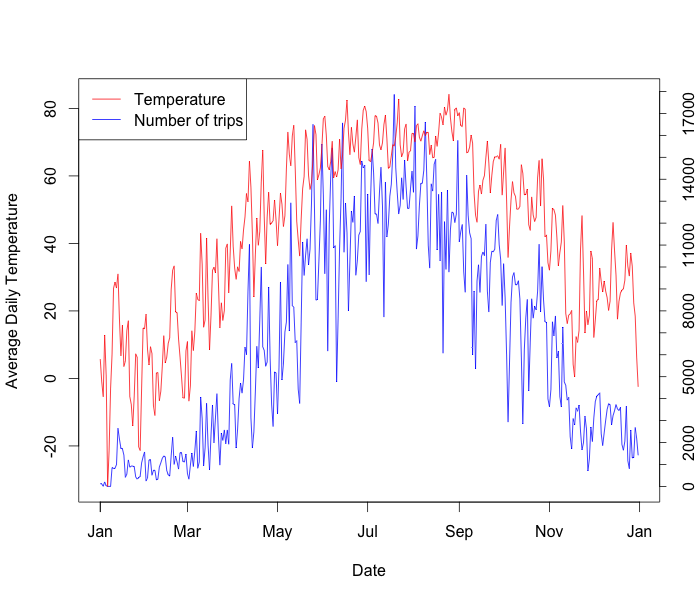 Figure 1: The number of trips taken each day of 2014 tracks very well with the temperature for the day. This is especially true for days when there is a significant increase in temperature. There’s nothing like a sunny day in March to make you want to cycle down the lakeshore!!
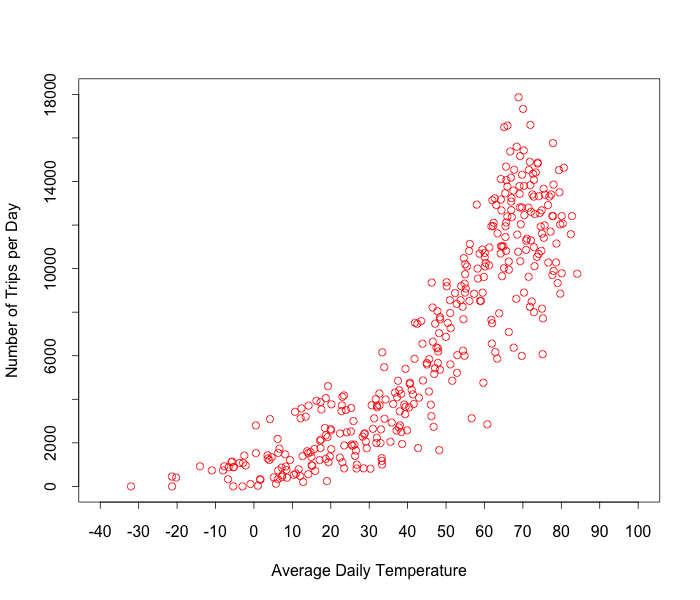 Figure 2: Temperature and number of trips taken correlate very well, following both a (temperature)2 trend or two linear trends above and below freezing. We don’t see any falloff in number of trips taken in very warm weather just yet.
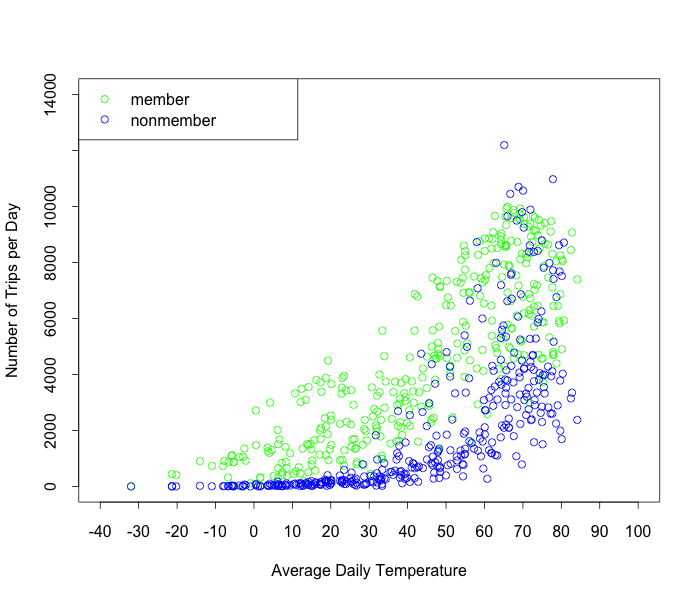 Figure 3: Members (those with yearly passes) and non-members (those with daily passes) show very different behaviour. Members tend to use Divvy for commuting and so travel even in very cold weather, whereas non-members use Divvy for pleasure, and there’s nothing pleasurable about cycling in below freezing weather, so they take very few trips below 32 degrees F.
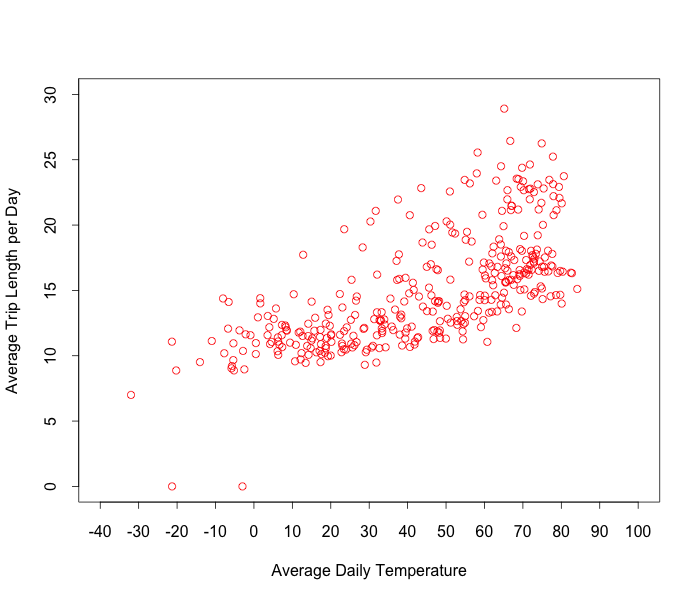 Figure 4: As temperature increases, the average length of a Divvy trip increases.
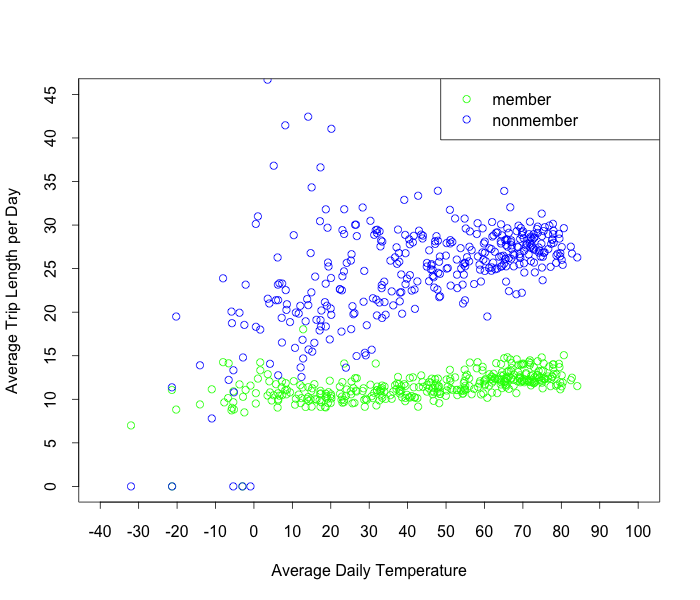 Figure 5: Members and non-members show very different behavior. Members take short trips in all weather but non-members take much longer trips and their trips get shorter as the weather cools down.
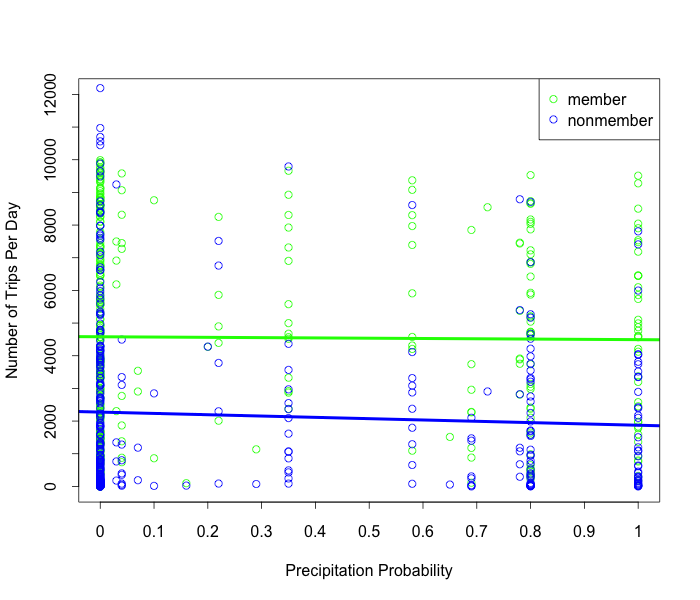 Figure 6: No correlation is seen between the probability of precipitation and number of Divvy riders. This is somewhat difficult to see in the points alone, so I’ve fit a straight line to the data to show that there is almost no decrease in the number of trips taken per day as the precipitation probability increases.
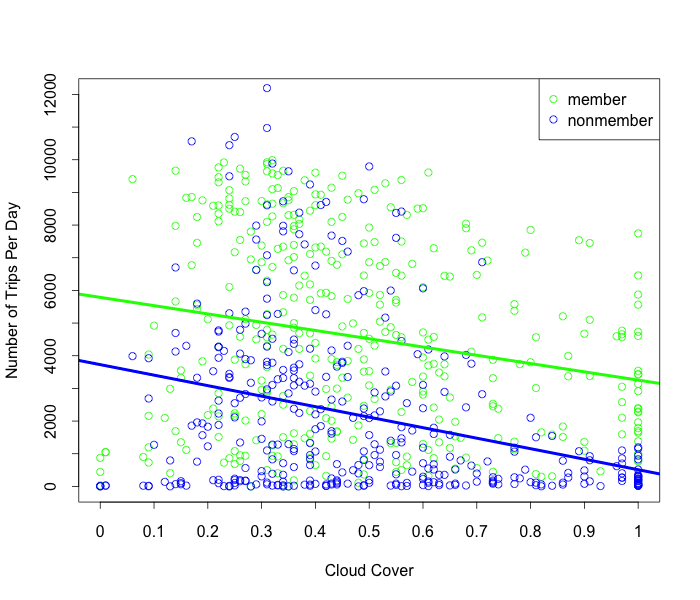 Figure 7: There is a strong correlation between cloud cover and number of trips taken, especially for non-members. If the cloud cover is above 75%, there are never more than 2,000 non-members trips, where there are up to 12,000 non-member trips on clearer days.
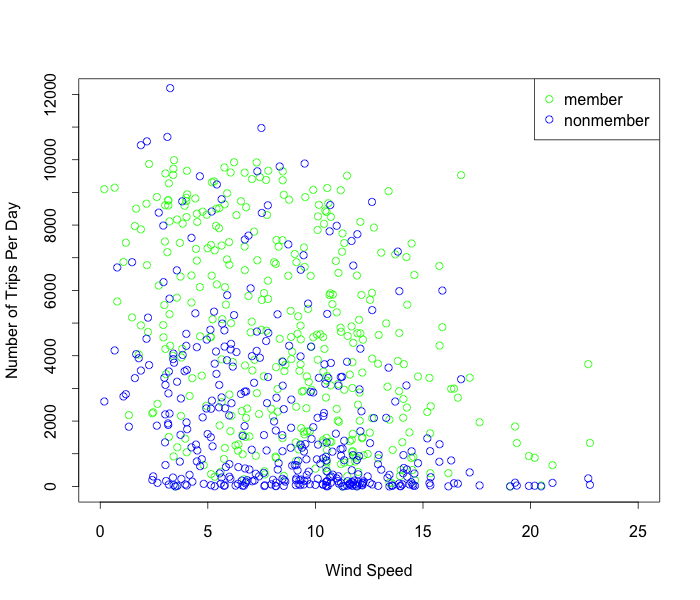 Figure 8: There is no correlation between wind speed and number of trips taken when the wind speed is below about 15 mph. Once the average wind speed for the day gets above about 15 mph, the number of trips for the day drops to much lower values.